601,259.
Those six digits separated by a comma ate at me more than I choose to admit.
OK. I’ll admit it. That number played an expert game of Pac-Man in my head for the better part of six years.
Then I learned to stop worrying and love the process (S/o to my “War Films” class in college where we watched “Dr. Strangelove or: How I Learned to Stop Worrying and Love the Bomb.” That’s why I entitled this post “Chasing Page Views or: How I Learned to Stop Worrying and Love the Process”).
Let Me Explain
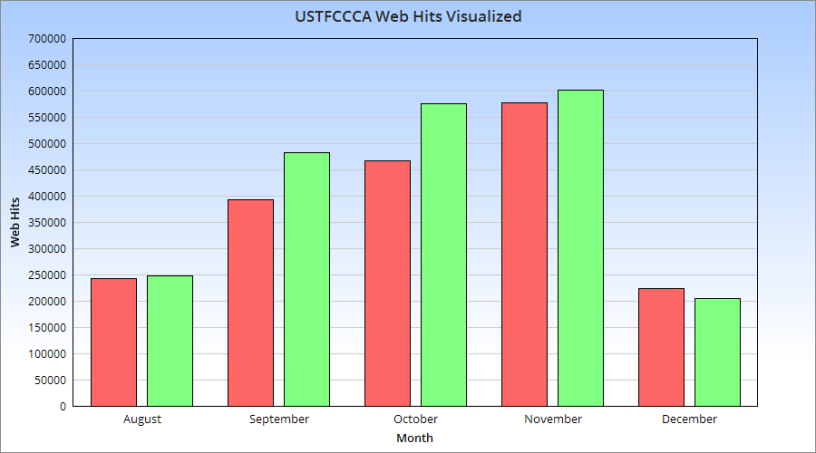
601,259 represented the biggest month in the history of the USTFCCCA website, as it pertained to page views. Buoyed by 95,762 users and a spike of 63,006 page views on Regional Championships Friday, November 2015 took over the top spot on the mantle from its predecessor, November 2014.
November 2015 was just my second full month on duty as Communications Assistant with the USTFCCCA. I joined the Association after a short stint at the Athens Banner-Herald as a Designer/Online Producer, where I immersed myself in SEO and other ways of driving website traffic, more so than I did before as Sports Editor at the San Marcos Daily Record.
This was a big way for me to see tangible results from my work. I crave it.
Fast Forward to November 2019
I had been directing our content plan as Communications Manager for a year and a half since my promotion in July 2018.
I wanted nothing more than to break that four-year-old record.
We took a healthy crack at it six months earlier in May 2019, and while our website had its first non-fall month with more than 500,000 page views – 534,638, to be exact – it fell woefully short. One of my biggest takeaways from those 31 days, though, was that Twitter is an exceptional tool for us: that blue bird accounted for more than 25,000 link clicks. (Find what tools work for you and play to your strengths. That goes for any industry, not just communications or digital media marketing.)
As I saw November 2019 climb the all-time chart, I pulled out all the stops: I fired out links in every other tweet; I published quick-hit articles to increase the amount of content on the website; I brainstormed new graphic ideas to capture more attention with one of my dynamo assistants Lauren Ellsworth, with whom I developed an immediate synergy over how we wanted to cover collegiate cross country and track & field. All of it had to work.
December 1 hit and I checked Google Analytics: 596,091.
My heart dropped. I felt like I failed. There was no way around it.
That record consumed me. Every single one of those 601,259 views.
The Pandemic Changed Everything
Four months later, the world screeched to a halt. Everything else didn’t matter, other than caring for each other and staying healthy during a raging pandemic.
Collegiate athletics went on hiatus for the better part of six months. That meant we had no polls or rankings to publish or sports to cover, which meant fewer visitors to our website, which meant a major hit on page views. I’m glad that we had a yearlong campaign planned to start in May, which took us through those desolate months until sports returned.
That campaign, entitled “NCAA 100: A Century of NCAA Track & Field Championships,” allowed our Communications Department to develop a closer bond as we navigated the 365-journey that challenged our patience, resolve and creativity. On a personal note, it allowed me to get back into feature writing (which I consider my bread and butter), work on becoming a better leader, and refine my tactics on social media, specifically Instagram.
Once #NCAATF x The Century wrapped up, things were pretty much back to normal for us at the Association (or whatever “normal” means these days): indoor track & field went off without a hitch and everything that came along with it; the postponed NCAA DI Cross Country Championships brought a lot of eyes to that sport thanks to its return to live television; and the outdoor track & field season delivered in spades with numerous collegiate records and the promise of an incredible #ChampionshipSzn to follow.
Hey, Siri. Play Green Day.
Truth be told, I didn’t check our page views until October.
“Wake Me Up When September Ends” would be pretty apt.
Well, when I checked the numbers, I couldn’t believe my eyes.
| Month | Page Views | Rank | Users | Rank |
| July | 285.2k | No. 1 | 70.9k | No. 1 |
| August | 207.1k | No. 7 | 66.3k | No. 1 |
| September | 582.1k | No. 1 | 116.2k | No. 1 |
NOTE: Those are all ranks within each of their respective months.
Our October Symphony
Then I got curious and checked our stats for October.
My jaw dropped. I couldn’t believe my eyes.
Not only was the best October in our sights – so was 601,259.
I knew we had been churning out great content (more so than ever before) – and working like a well-oiled machine – but we weren’t doing anything different than any of those previous months. Then it hit me: the more you try to force something – especially in industries like communications, digital media or social media – the less likely it will work.
Even though I plugged daily numbers into a Google Sheet to see updated projections, I didn’t obsess over it. Instead, I focused on everything that I could control – managing workflow, delivering on social media, etc.
November 1 hit and I checked Google Analytics: 673,996.
I smiled, jotted down a quick note and got back to work.

